Capital Market Line (CML): Definition & Formula
According to the capital market line, all investors have identical observations and will observe the same efficient frontier. Investors can combine the riskless security with different efficient portfolis.
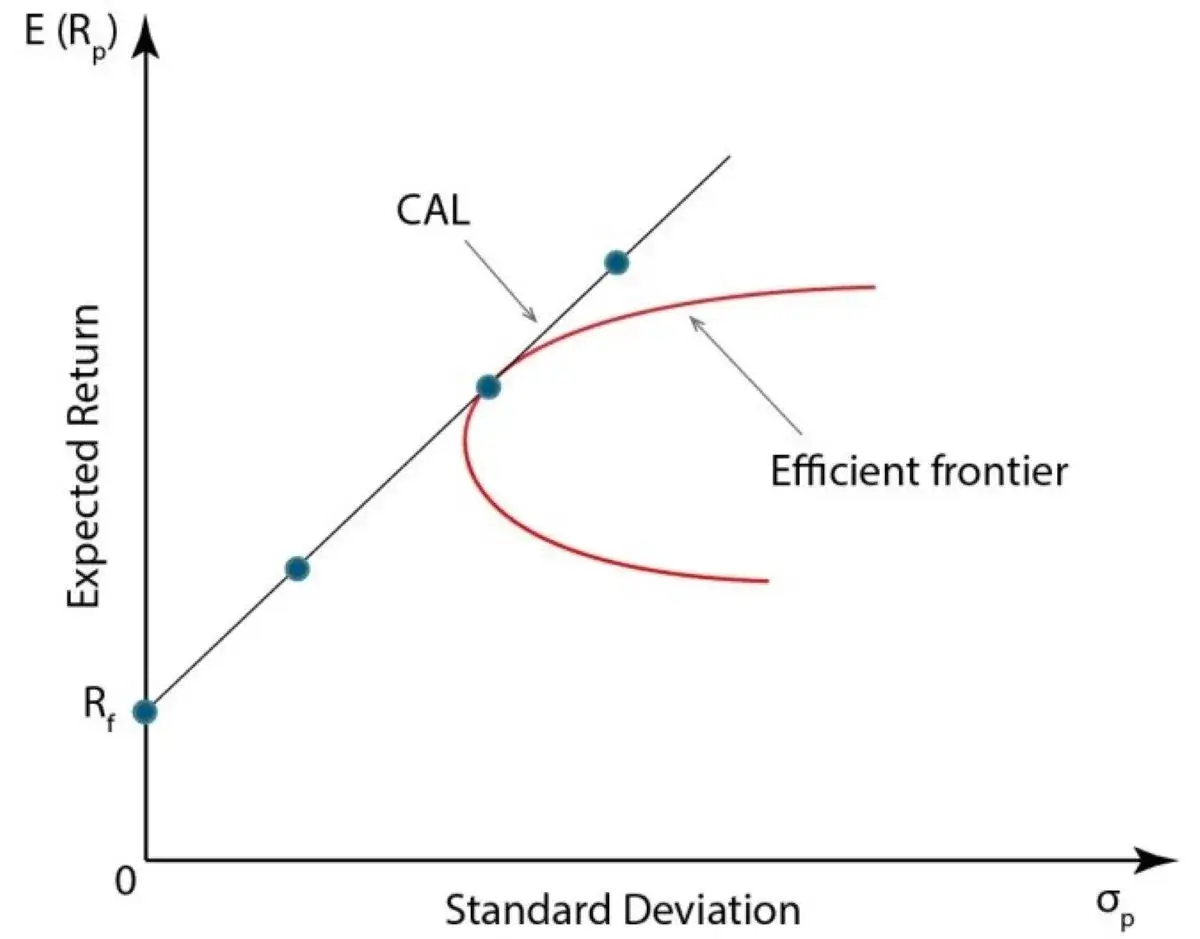
The best combination of efficient portfolios is lying on the straight line drawn from the riskless security tangent to the efficient frontier. The portfolio at the point of tangency is the market portfolio and the equlibrium condition requires that every risky security is included in the portfolio.
The new linear efficient frontier is the same for all the investors and is composed of linears combinations of the riskless security and the market portfolio. Individual preference will determine only the amount of borrowing or lending. That is, the financing decision to borrow or lend is independent of the choice to invest in the market portfolio. The implication of the theory is called the separation theorem.
E(Rp) = Rf + E(RM) –Rf
In general, the capital market line is the efficient frontier for portfolios composed of the riskless security and the market portfolio
The capital market line is a linear equilibrium relationship between expected return and risk.For efficient portfolios, the appropriate risk measure is the standard deviation of return.
On the other hand, the risk for individual securities or inefficient portfolios is measured by beta, a measure of systematic risk. Only efficient portfolios are lying on the CML while all individual securities and portfolios are positioned on the SML, each line intercepts the expected return axis and the riskless rate of interest. The slope of the CML is ( Rm-Rf ) / σm .
The slope is the market risk premium (Rm-Rf) all divided by the standard deviation of returns on the market portfolio. The CML is a straight line with an in intercept at Rf. The slope reflects the aggregate atitude of investors toward risk. The CML specifies the ralationship between risk and return of efficient portfolios ,that is those that lie on the CML. Investors are more concerned with the relationship between risk and return for individual assets.
The SML shows that an individual stock’s return is equal to the risk free rate plus a premium for bearing risk. So, the risk premium is equal to the market risk premium,RPm, multiplied by the risk of an individual stock as measured by its beta coefficient.
E(Ri) = Rf + ( E (RM)- Rf ) ßi
ßi = Cov im
Unlike CML for a well-diversified portfolio, the SML tells us that the standard deviation of an individual stock should not be used to measure its risk, because some of the risk as measured by standard deviation can be eliminated by diversification.
Beta reflects risk after taking diversification benefits into account , so beta rather than the standard deviation is used to measure individual stocks’ risk to investors.
A stock’s risk premium will be greater or less than that of an average stock depending on whether its beta is equal to, greater or less than one.
ß= 1 average risk stock
ß> 1 high risk stock
ß< 1 low risk stock
BETA COEFFICIENT:
The tendency of a stock to move with the market is reflected in its beta coefficient. Since a stock’s beta measures its contribution to the riskiness of a portfolio beta, it is the theoretically correct measure of a stock’s riskiness.
Beta can be calculated by plotting the historical returns of the market portfolio on the x-axis versus the historical returns on a stock on the y-axis and fitting a regression line. Sharpe called this the characteristic line. The regression estimate of the beta of any single company is uncertain because if regression results reveal a beta of 1.09 (b= 1.09) within 95% confidence interval, the actual beta will range between 0.72 and 1.46 which is a wide range.
THE BOTTOM LINE
In the presence of a risk-free asset, all efficient frontier portfolios lie on the Capital Market Line.
- Investors hold only portfolios on CML
- The risk of an efficient frontier portfolio is its StD
- CML gives the trade-off between portfolio risk and return
Related Topics: